
By Steve Cavolick
Baseball season is upon us, and at this early stage, every team still has a chance to play in October (except you, Marlins. Sorry.). Baseball is a game of adjustments, and one tweak that has occurred over time is the role of #2 hitter in lineups and the placement of the team’s best hitter. Analytics and statistics are behind redefining that role, and identifying of the type of player that should be batting in the second spot.
When you think about the #2 hitter, who do you picture? As a baseball fan who’s watched thousands of games, I see smaller guys who are slap hitters, who are fairly fast, who stay out of double plays, and are willing to advance a runner. Hall of Fame player and manager Johnny Evers defined the traditionally-accepted role of the #2 hitter in his book Baseball In The Big Leagues:
“…The third batter in any team is the most important. He must hit long flies, hit hard, bunt and run, because ahead of him in a well constructed team are two batters who are on the team for their ability to “get on,” and the third man must be able either to move them up or hit them home.”
So in the traditional view, the #2 hitter is a second lead-off man and the best, most productive hitters should bat third.
I grew up watching the Chicago Cubs, and I can tell you that the players who batted second for them were exactly the kind of players who fit the Evers’ definition of a #2 hitter. Focusing on opening day rosters for the Cubs, take a look at the players who filled the #2 spot from the late 70s through 2007, and their key offensive career statistics. I am also issuing a pre-emptive apology for making you review the names of so many forgettable and just awful players, but this is representative league-wide of the skill set seen in the #2 hitter during this time.
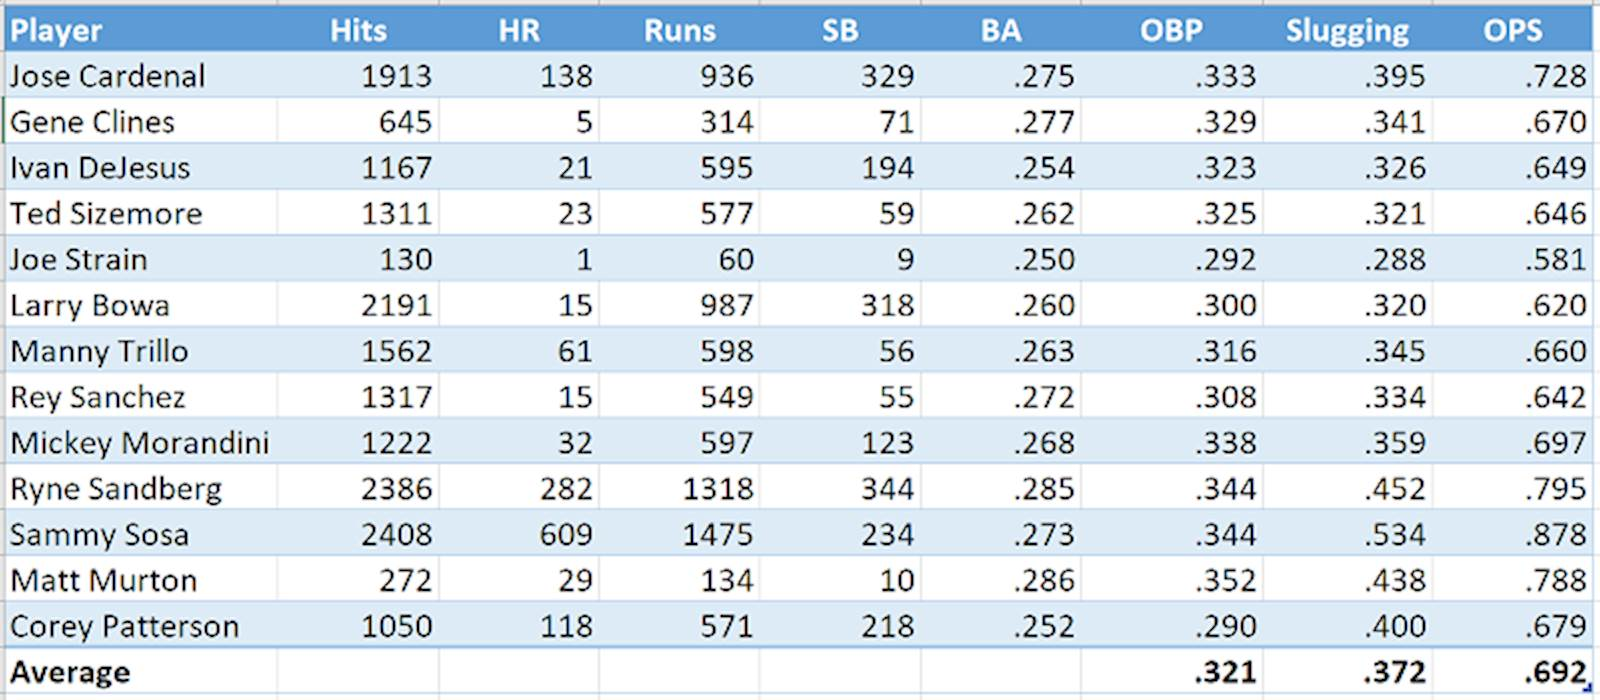
Sandberg and Sosa are exceptions, but most of these players are light hitters, could steal bases, and were OK at getting on base.
Now let’s look at some of the players who batted second during the first week of May this year and their career stats:
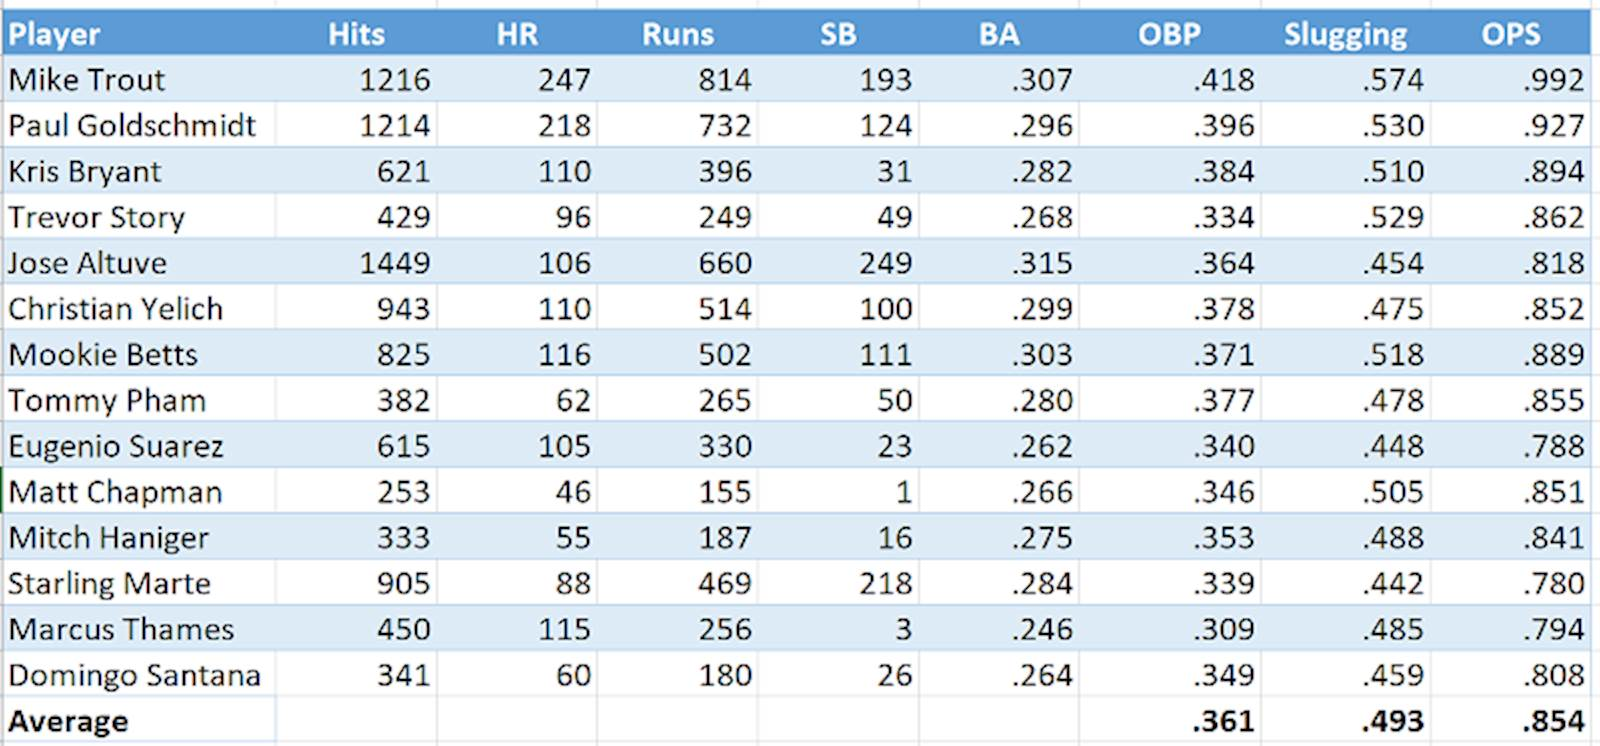
You see several league MVP winners and players who hit for power. Pay special attention to the difference in career On Base Percentage (OBP) and Slugging (total bases divided by the number of at bats) in the two groups of players. The average OBP is 12% higher in the 2019 group of players, but the average Slugging is 33% higher. These players get more extra base hits, drive in more runs, and put themselves into scoring position more than the previous generation of #2 hitters.
So why are sluggers batting earlier? There is a very strong correlation between batting order and run production. Statistics show that the #2 hitters get between 40-50 extra plate appearances per season than the player batting third or fourth. Statistics further demonstrate that more of the at-bats from the #2 spot come with fewer than two outs.
The conclusion based on these statistical nuggets is that you are wasting your best hitter if you put them in the 3 or 4 spot in your lineup. Batting your best hitter #2 places them in more positions to get on base and drive in runs over the course of the season. How many times have you been watching your favorite team with them trailing late in a game, and you were hoping to get to the #3 or #4 hitter (positions traditionally saved for productive hitters) so they could get a big hit and tie it up? If the best hitter was hitting second, they would get an At Bat sooner.
Teams unsure on how to construct a lineup can lean on analytics for help. To see predictive lineup models in action, you can try one out for yourself with this Lineup Analysis tool. You’ll need to gather the On Base Average and Slugging percentages for the players on your team and type them in, but it’s a fun way to see how analytics can take guesswork out of things like creating the optimal batting order.
Whether you are optimizing a lineup or a supply chain, the success of your analytics initiative depends on your ability to source, cleanse, secure, and visualize your data. That’s the LRS sweet spot. Let us help.
The LRS Big Data and Analytics team has over 20 years of experience in statistics, information management, predictive analytics, and data warehousing. If you are interested in understanding how we can help you find value in your data with advanced analytics, please fill out the form below to request a meeting.
About the author
Steve Cavolick is a Senior Solution Architect with LRS IT Solutions. With over 20 years of experience in enterprise business analytics and information management, Steve is 100% focused on helping customers find value in their data to drive better business outcomes. Using technologies from best-of-breed vendors, he has created solutions for the retail, telco, manufacturing, distribution, financial services, gaming, and insurance industries.