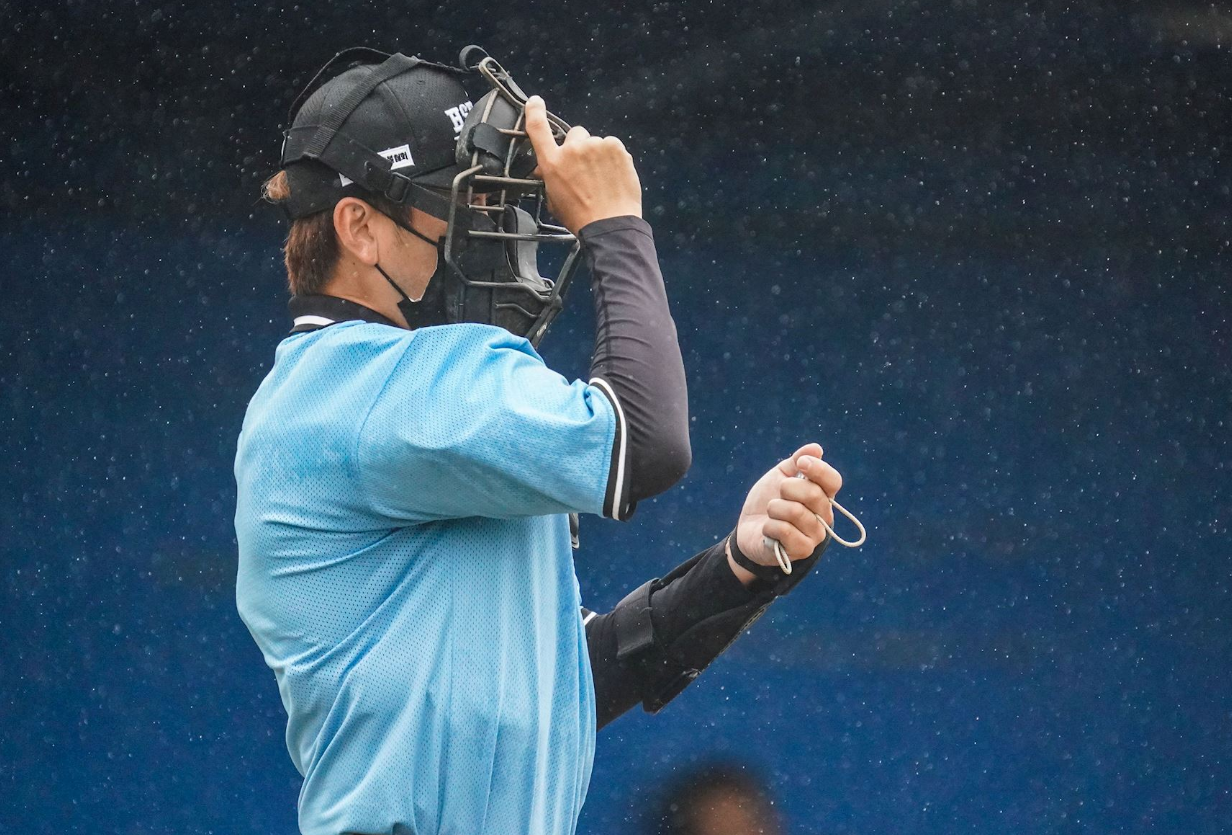
Baseball’s World Series is still on while football, basketball, and hockey are underway. Tampa Bay and Milwaukee, small-market teams with payrolls ranked 28th and 19th, according to CBS Sports, are playing for the title. The Dodgers and Yankees, two of the top three biggest spenders, went home early.
This was also the first season of the Automated Ball-Strike (ABS) system, which grades each pitch against a zone set by the batter’s height. Each team gets two challenges per game and keeps its challenge when it wins and loses it when it’s wrong.
My May blog, written six weeks into the season, flagged early patterns. Umpires were calling a smaller zone, likely in anticipation of being challenged, and the league walk rate had jumped from 8.4% in 2025 to 9.6%. First-pitch challenges were overturned 57% of the time.
After a full 162-game season that included 10,557 challenges, let’s examine which numbers were an early blip as the league became accustomed to ABS and which ones held up for the entire year.
The Spike In Walks Was A Transitional Cost: In my May blog, the walk rate of batters peaked at 9.6%. It ended the year at 8.89%. It was higher than the previous season of 8.4%, but much less than the early season increase. The explosion of walks I noted early retreated towards a mean. The system remained the same, but it appears the players adjusted to ABS quickly. Strikeouts remained flat at about 22% for early season and full-season measures.
The Shape Of The Strike Zone: One of the biggest changes noted by FanGraphs in the early weeks of ABS was that umpires called strikes on pitches that were 0-4 inches above the strike zone 40.8% of the time, compared to 54.3% the year before. I could not find this stat for entire season, but through late September, Baseball America calculated that the actual called strike zone stood at 411 square inches. This represents a tightening of the borders across the 2026 season compared to the 455 square inches seen in 2025. Walks fell back even as the zone stayed small, which suggests the players did the adjusting.
The Challenge Became An Important Skill:
Challenges per game rose every month. In March, the average was 3.76. By September, it rose to 4.61. The overturn rate held near 54% throughout the season, but the numbers changed slightly depending on who initiated the challenge: batters closed the gap, going from 46% in the spring to 48.8% in the full season, and catchers were steady at around 59% in the early and full-season metrics.
The Strategy Of When To Challenge: In May, first-pitch challenges were overturned 57% of the time and 2-2 challenges only 44%. The full season confirmed the pattern. Teams won 59.8% of first-pitch challenges and 46.7% at 2-2. At 3-2, the success rate fell to 41.0%. Leverage tells the same story. Challenges in low-leverage spots succeeded 57.8% of the time, but in the highest-leverage spots that dropped to 46.1% across 878 challenges. One possible read is that as a game tightens, teams challenge on a hunch instead of a clear miss. The data can’t prove that, but the pattern is hard to ignore.
Catchers Picked Up A Second Job: In May, I said pitch framing was under pressure. It still matters, and now catchers carry another skill. They filed 5,609 of the 10,557 challenges. According to ESPN, William Contreras won 105. J.T. Realmuto won 81.4% of his, and the Phillies led pitcher and catcher challenges at 69.4%. Drew Millas of the Nationals won only 43.1%.
Same rules, same cameras, same two challenges per game. The Reds won 61.6% of theirs and the Pirates won 47.0%. Enterprise AI looks the same: organizations with identical technology get very different results, and the difference is data readiness and operational discipline.
Do you want to explore how AI can transform your business? Please Contact LRS to book a meeting with me and our AI specialists. Don’t have a data architecture for AI you trust yet? LRS can help you collect, organize, and analyze your data so that it is business-ready.